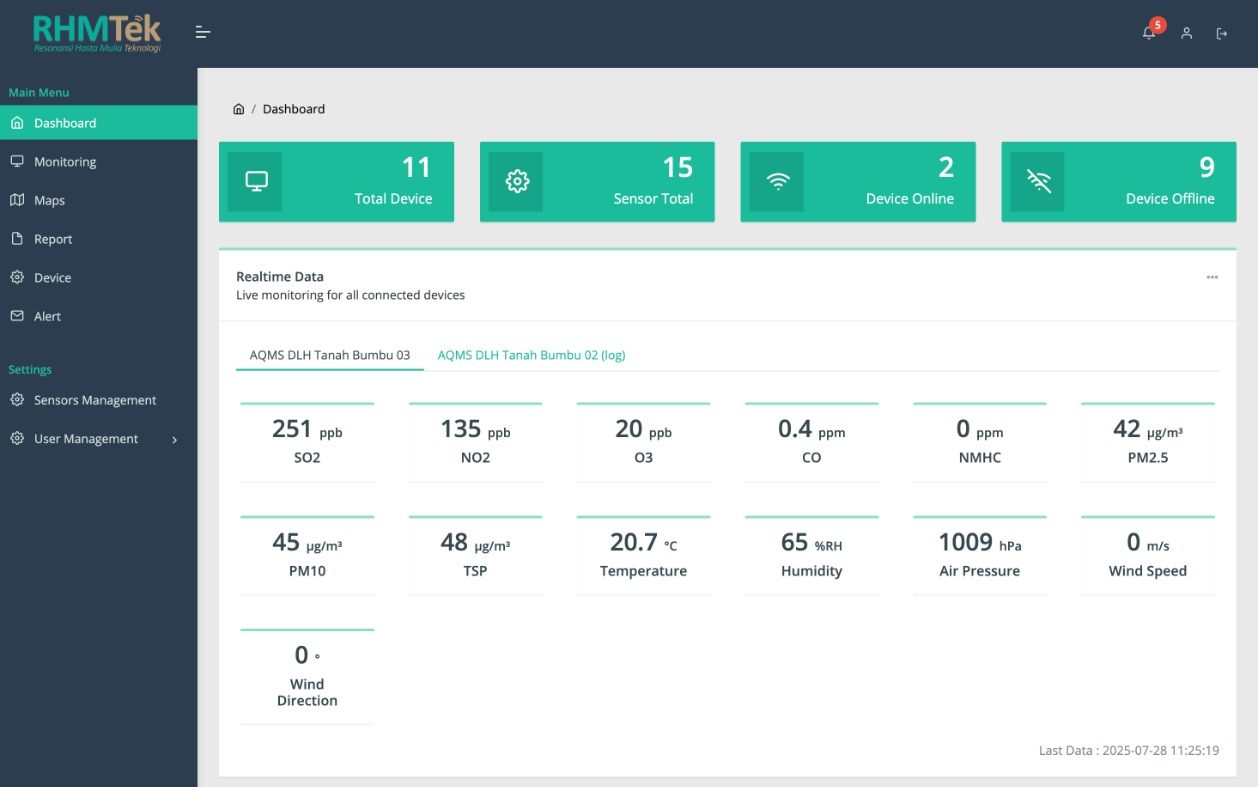
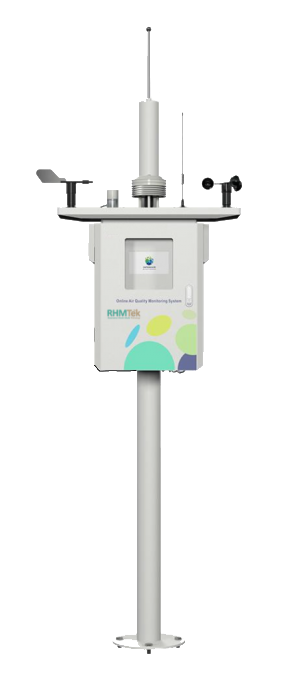
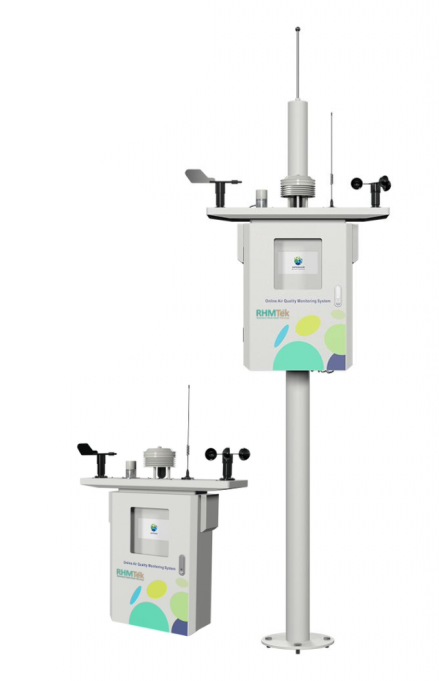
Dashboard AQMS Device

AQMS

Air Quality Monitoring System

Seamless, Highly Accurate,
and Real-time Air Quality Monitoring

Key Features :

  • 24/7 real-time air quality monitoring
  • Multi-pollutant sensors: PM2.5, PM10, CO, NO2, O3, and more
  • Web and mobile-based online dashboard
  • Live station map with interactive features
  • Historical data storage and trend visualization
  • Automated reporting
  • Device and sensor management

Our AQMS platform delivers seamless, real-time air quality monitoring with high-precision sensors and an intuitive online dashboard — making clean air data easily accessible, anytime and anywhere.

Sensor & Hardware Specifications

Sensor Specifications

  • Target Parameters: CO, SO₂, NO₂, O₃, PM2.5, PM10, temperature, humidity, wind, solar radiation, and rainfall
  • Response & resume time: ≤ 120 seconds
  • Resolution: 1 µg/m³
  • Sensor lifespan: 3 years
  • Operating Conditions: -20°C to 50°C and 15-90% RH
  • Storage temperature: -20°C to 50°C

Device Connectivity

  • Supports LoRaWAN, Wi-Fi, LTE, and NB-IoT
  • Remote device access and configuration
  • Real-time data transmission to cloud server
  • Secure and encrypted communication protocols
  • Integrated GPS/GNSS for high-accuracy mobile monitoring

Power & Efficiency

  • Internal battery powered for 3 years
  • Power consumption ≤ 1W
  • Solar power (Optional)

Environmental Durability

  • Operating temperature: -20°C to 50°C
  • Humidity: 15-90% RH (non-condensing)
  • Barometric pressure: 81-121 kPa
  • IP65 rating

Device Dimensions & Build

  • Enclosure material: UV-resistant ABS plastic
  • Dimensions: 220 × 180 × 80 mm
  • Weight: Approximately 1.5 kg
  • Mounting options: Compatible with wall and pole mounting brackets
  • Ingress protection: weatherproof for outdoor installation
Full Station

Platform Features & Capabilities

Smart Monitoring Dashboard

  • Instantly visualize air quality conditions in real time
  • Supports a wide range of parameters: PM2.5, PM10, CO, SO2, NO2, O3, temperature, humidity, and more
  • Clear trend graphs for daily, weekly, and monthly insights
  • Real-time map of device locations and coverage zones

Data History & Analytics

  • Access historical data by specific date or custom time range
  • Periodically store and manage air quality records with ease
  • Analyze long-term trends and support predictive pollution forecasting

Interactive Air Quality Map

  • Display device locations on a live map with real-time AQI values
  • Show air quality status based on AQI classification ranges
  • Visualize spatial distribution of air quality data across monitored areas

Automated Reporting

  • Generate daily, weekly, or monthly reports
  • Export structured PDF reports with charts and comprehensive data summaries
  • Designed to support environmental audits and ensure regulatory compliance

Device & Sensor Management

  • Add, edit, or deactivate sensors and devices
  • Monitor device connection status (online/offline) in real time
  • Configure and manage device connectivity with ease
s